The following is an introduction to some of the debugging techniques that you can use if you are stuck on a tricky bug. This includes debugging both tests and demos, as well as constructing your own files to debug.
Debugging Files - Using the VSCode Debugger
First, navigate to the test file you wish to debug, and do the following: (1) Set breakpoints on the lines/functions you want to investigate (2) Now, navigate to the “Run and Debug” menu by clicking the bug-and-play button on the left (3) In the dropdown menu, select “Debug active file” (4) Click the green play button
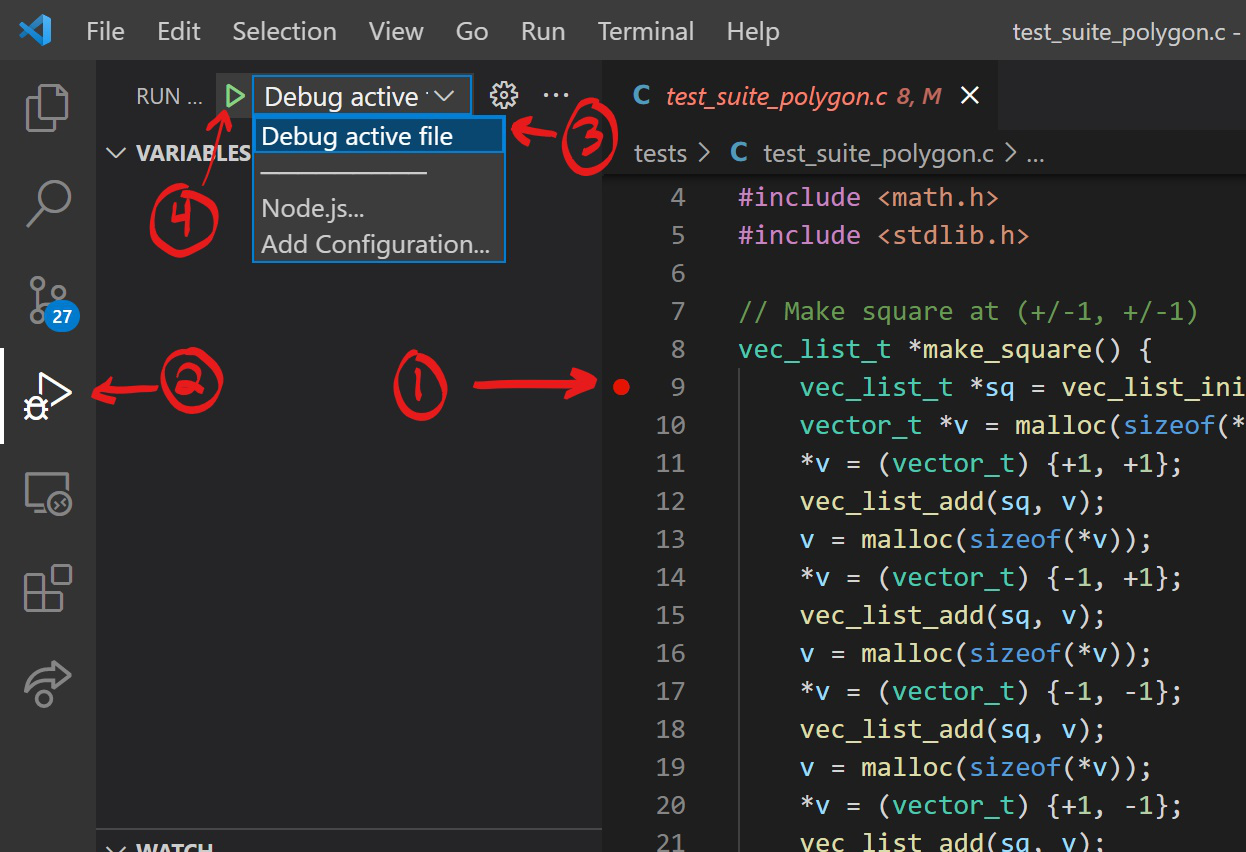
Make sure you have the file open that you wish to debug
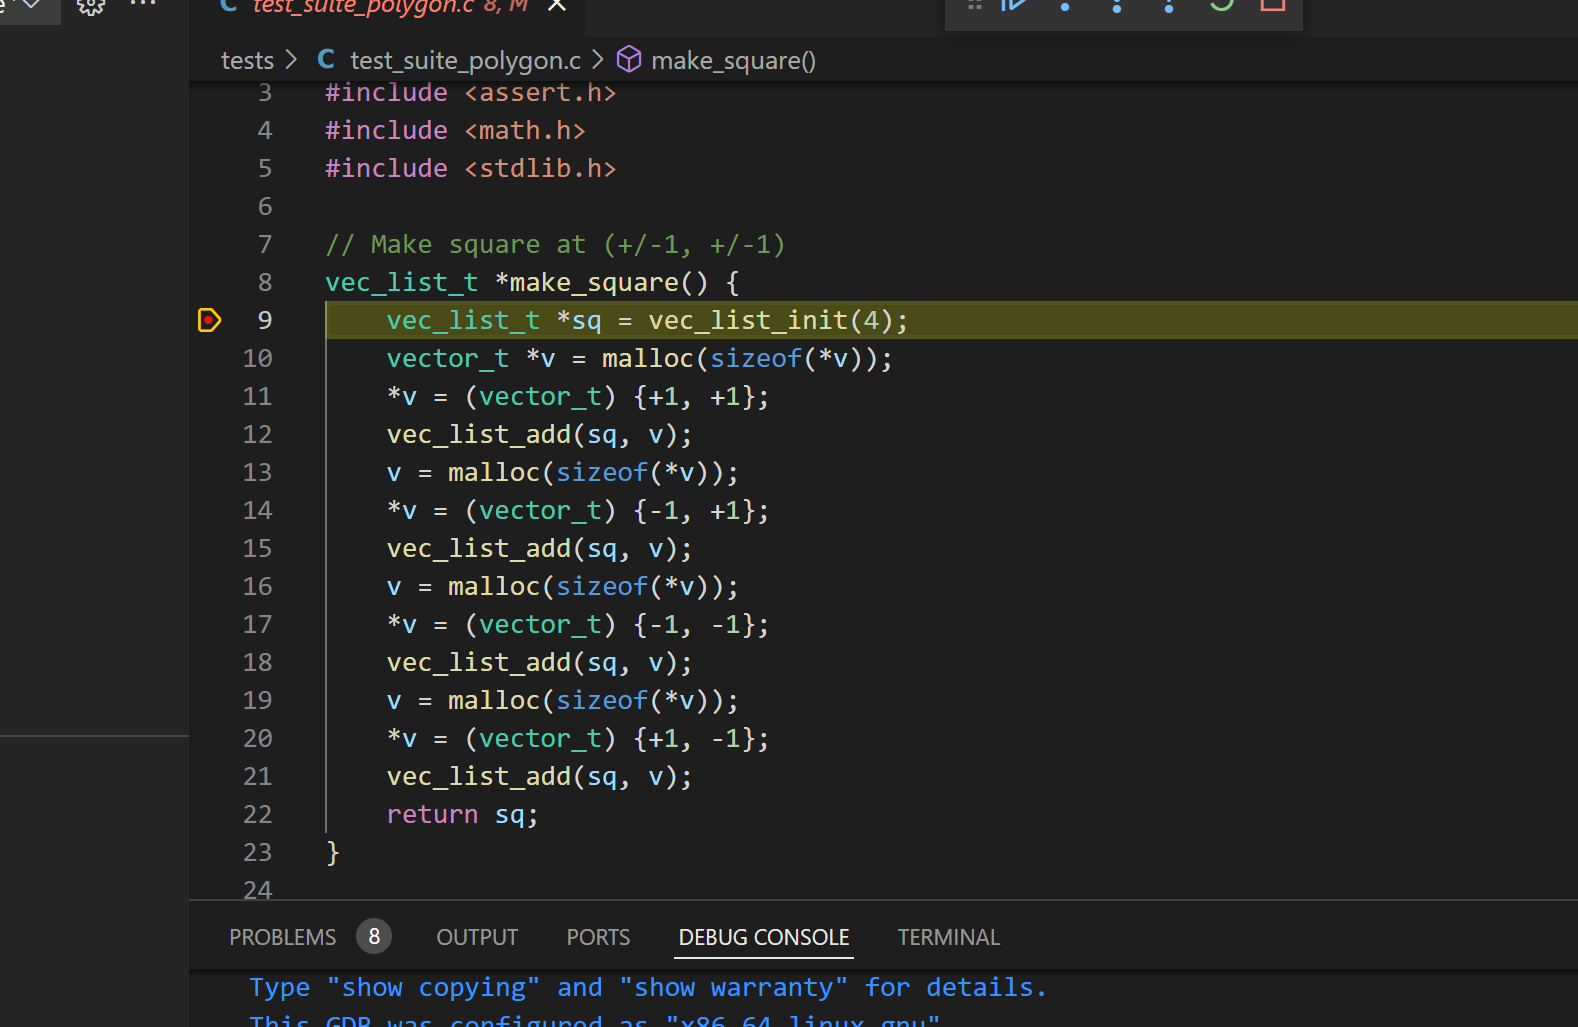
You should see the debugger terminal start up. After a moment, the debugger should jump to the line where you’ve set your breakpoint, as shown below.
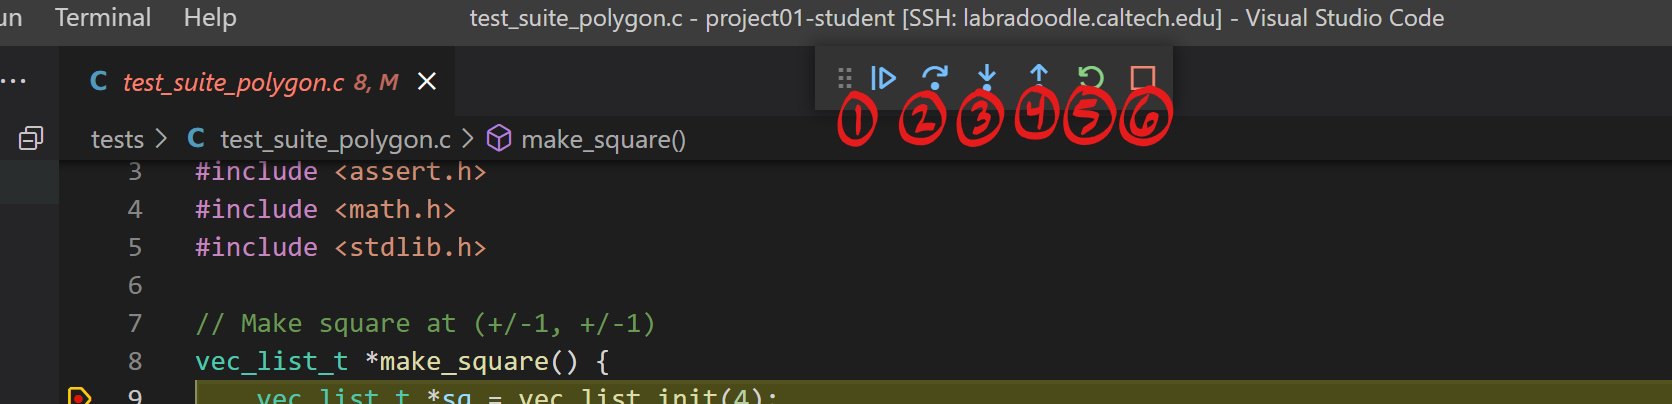
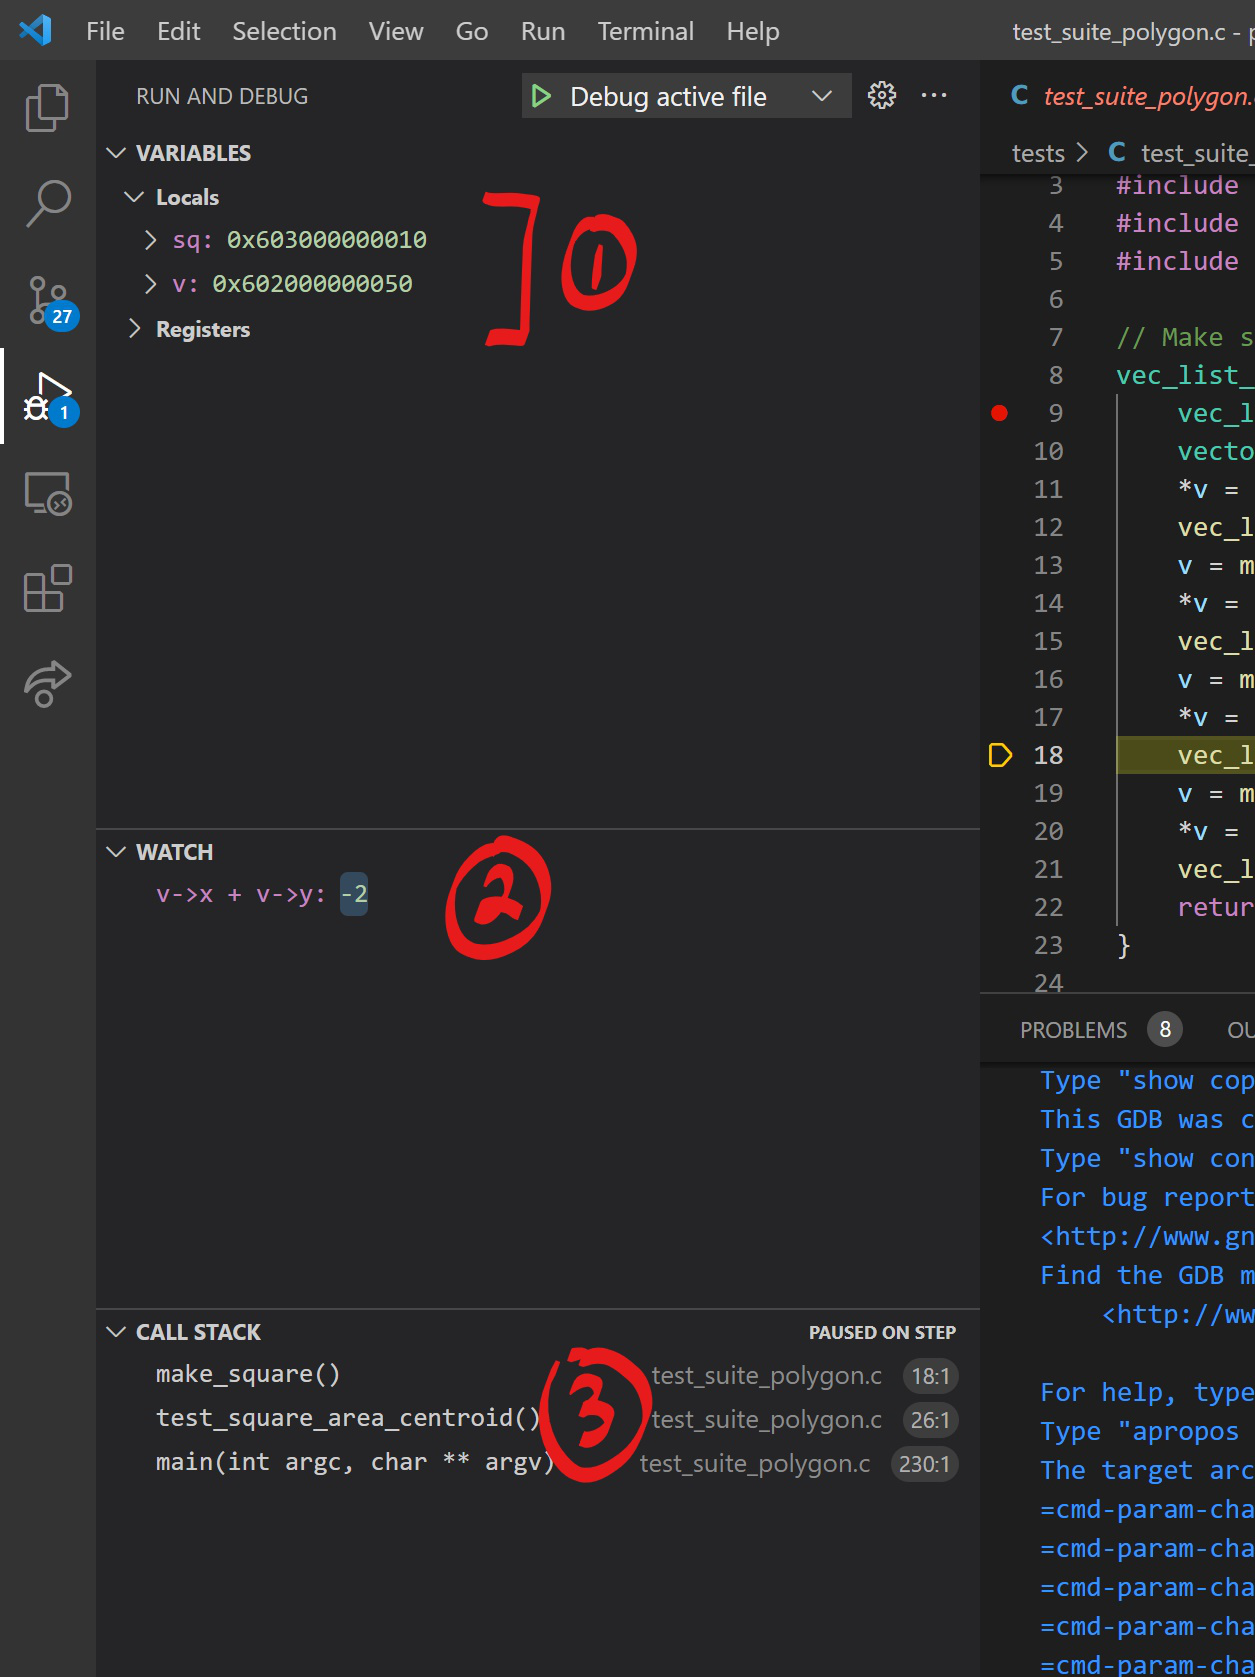
You will see a menu of buttons at the top. (1) jumps to the next breakpoint/continues execution if no future breakpoint is set. (2) is akin to the ‘Step over’ button in Intellij, and steps to the next line of code in the function. (3) is akin to the ‘Step into’ button in Intellij, and steps to the next line in the execution, which may be in a different function. (4) “steps out” of the function, to the line where it was called, essentially allowing the function to finish executing by itself. (5) restarts the debugging process. (6) stops the debugging process.
As with Intellij, you are free to set more breakpoints as you debug. As you step through your code, (1) you will see variable values to the left that you can monitor through your execution. (2) You can also watch certain expressions as you step through your code. (3) Finally, the call-stack is also helpful - it is to the bottom left.
Advanced - Creating Your Own Files to Debug
You may find yourself in a situation where you want to debug files that aren’t just the tests. Maybe you have a problematic portion of code in your demo, or want to further test a function. To do this, you can make a new file to debug as follows.
First, make the file - you can put it in the tests folder. In this example, it is named “student_test.c”. Put any code or functions you want to test into this file. You should not make any sdl calls in this file, as otherwise it will not compile. Make sure it has a main that calls whatever functions you want to test.
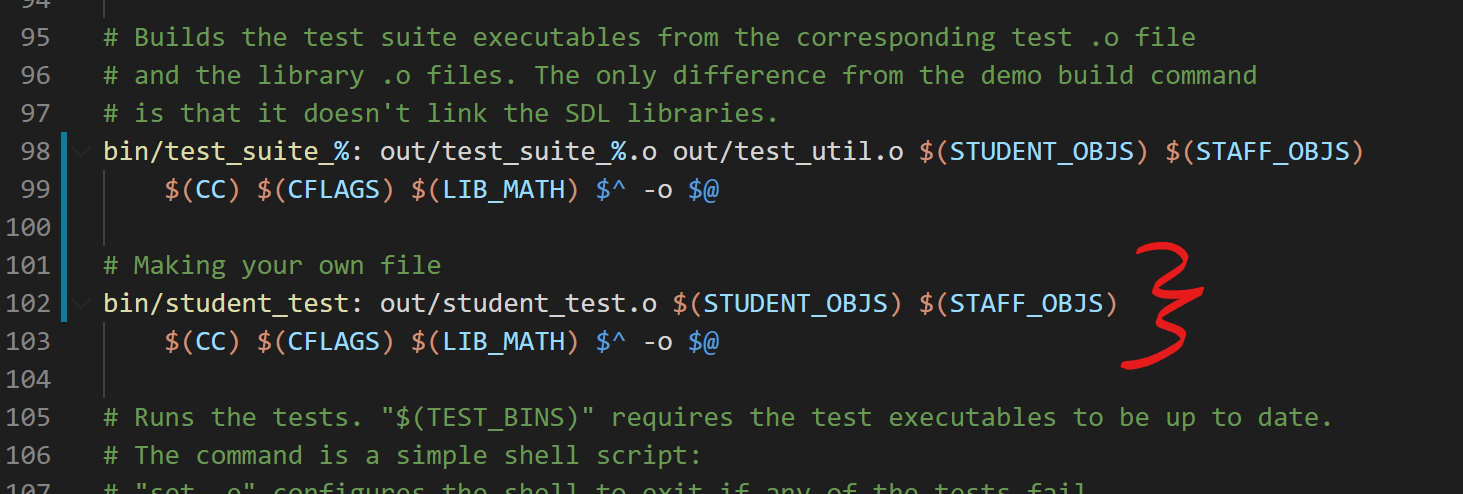
The last thing we have to do is update the Makefile such that we can run the debugger. This involves making a rule to make your c file. If your file was called ‘student_test.c’, you could add this rule to the Makefile, to compile the executable student_test for the debugger:
bin/student_test: out/student_test.o $(STUDENT_OBJS) $(STAFF_OBJS)
    $(CC) $(CFLAGS) $(LIB_MATH) $^ -o $@
Now, after running make bin/student_test, navigate to the debugger, open your file, set your breakpoints, and debug away!
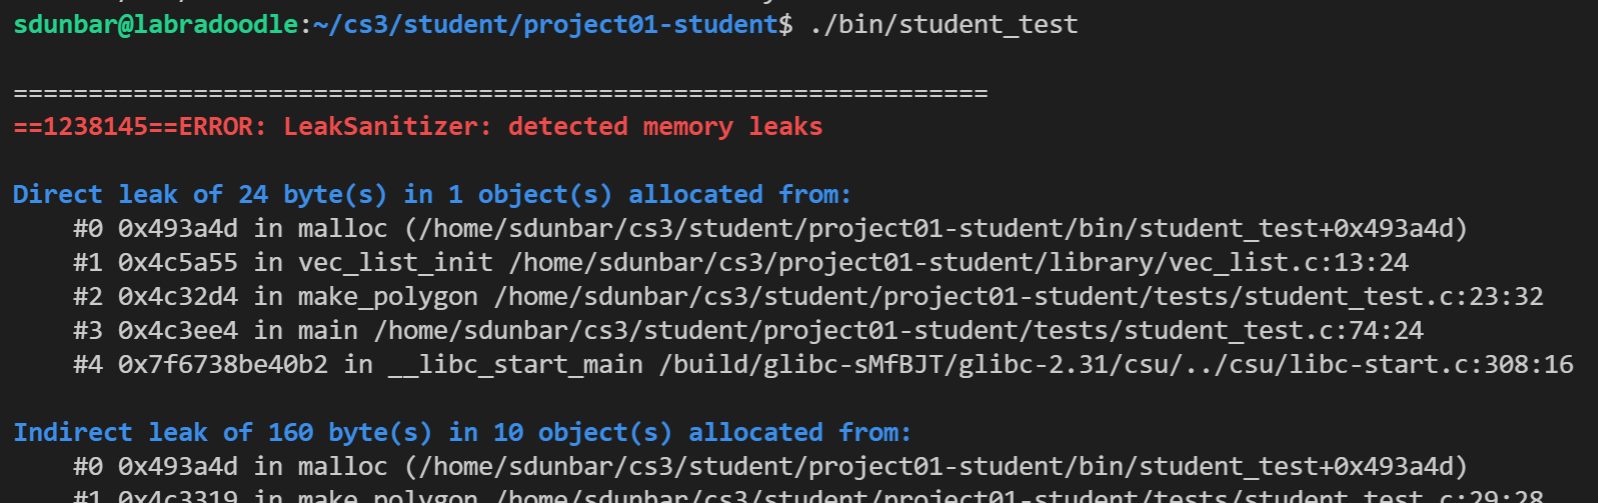
A Note on Finding Memory Leaks
If you run ./bin/student_test, if your file leaks any memory, asan will helpfully output where it is (this will be covered in more detail in a future course lab). This can be helpful if you suspect your demo is leaking memory but aren’t sure where. Interpreting these kinds of messages will be covered in more detail in a future lab in the course.